Last week, I introduced a pattern of disruptive innovation. My goal : anticipating disruptive innovation. This week and next week, I’ll illustrate how to anticipate disruptive by using a couple of graphs. Again, understanding why once leading companies in their industries got wiped by new entrants is critical to any business. This pattern of disruptive innovation explains why:
- Kodak, a leader in chemical photography, was wiped out by digital photography
- The entire CD-based music industry was wiped out by digital media, which itself, may get wiped out by streaming media
- Sears, a leading retailer, got wiped out by hard discounters
- Digital Equipment Computers, a leading computer company in the 1970s got wiped out by Apple and IBM
- Xerox, a leading copy machine company, got wiped out by printers
- Telegraphs were wiped out by telephones
- Microsoft, a leading software company, may get wiped out by SaaS software
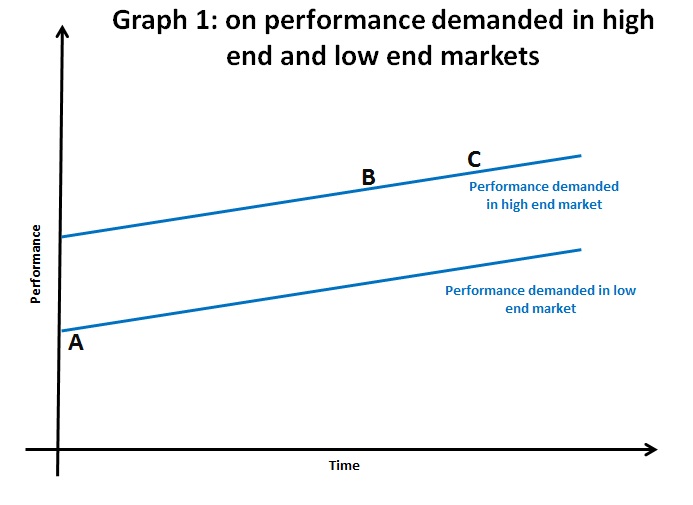
To illustrate what how disruptive innovation works, I’ll be referring to 3 graphs. The first graph, below, plots product performance over time.
Comments on Graph 1 help at anticipating disruptive innovation
One of the most critical questions in understanding the nature of disruptive innovation is the meaning of performance. Performance is both relative to an industry and relative to a market segment in each industry.
For example, in automobile, performance may be defined as:
- the speed at which a car can go from 0 to 100KM/H
- maximum speed
- gas mileage
- distance the car can travel on a full gas tank
These are just some of the most prevalent definitions of performance in automobile, and there are surely many more.
Depending on the market segment you’re looking at some definition of performance may become more important than others. For example:
- maximum speed and speed from 0 to 100KM/H are obviously predominant performance criteria in sport’s car market segment.
- in the city car market, gas mileage is probably a more important performance criterion than maximum speed, given that maximum speed is limited in large cities.
In the hard drive industry (also known as “disk drives”); performance criteria may vary as well. For example:
- in portable devices such as smart phones and ultraportable computers, an important performance criterion is ruggedness. In other words, as portable devices get carried around, consumers are looking for a sturdy and solid hard drive which can withstand being bumped around without getting broken.
- in the Desktop PC market, ruggedness is less important, because Desktop PCs don’t get moved around, while storage capacity (that’s the number of Gigabits that one could store on a hard drive) becomes a more important performance criterion.
Understanding the different criteria of performance and their different rank order (that is how each criteria ranks against one another) helps to differentiate one market segment from another.
What Clayton Christensen found out was that performance demanded in both high end and low end markets is remarkably linear, as represented by the blue lines. Let’s look at the hard drive industry, which we will segment into the hard drive industry for Smartphones and the hard drive industry for Desktop PC. As performance can mean many different things, we’ll assume that we’re looking at storage capacity as being the key performance criteria. In each of these markets, there has been a linear progression in performance demanded by both markets, such that, they are, overall, parallel.
This begs the following question: what are the performance criteria in your business and how do they rank with one another? If you were to plot performance criteria, how would it evolve over time?
Comments on graph 2 help at anticipating disruptive innovation, as well
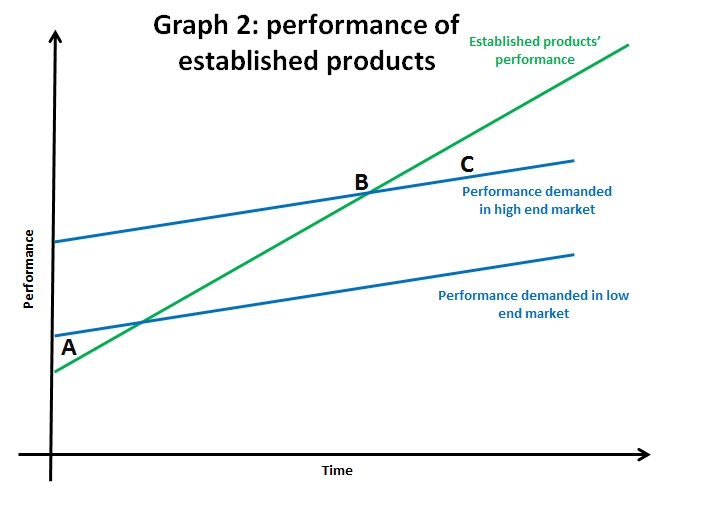
There’s only one difference between graph 1 and graph 2 and that’s the green line, which represents established products’ performance over time.
First of all, in point A, when established products performance is below performance demanded in low markets, the really key question is finding a relevant market for an underperforming technology. Successful companies are not those that push their technology in an existing market, with existing customers. For example:
- when Sony first launched its transistor radio in the late 1950s, it would have been a big mistake to make it compete against existing home radios, offering superior audio quality.
- But, if the transistor radio could be marketed as a portable device, something that existing home radios could not offer because they weren’t portable, then Sony had a chance of finding a market for what was, otherwise, an underperforming audio technology, given the standards in the home radio market segment.
In other words, the key to getting from point A to point B is accepting the technology as it is and finding a market that accepts the technology’s limitations and value its distinct qualities. By marketing the transistor radio to young adults, Sony appealed to new customers and created a new market.
Second of all, in point B, established product performance, having been financed by a new market, new clients and continous R&D investments, is improving significantly. And this constant improvement over time is the result of sustaining innovations, which keep bringing incremental improvements to existing products. For example:
- in their quest to reduce gas mileage, automobile manufacturers are adding new features, such as, “stop and start”, a technology for automatically stopping and starting a car’s engine in order to save gaz.
- in the computer industry, players have been able to double capacity every 18 months, thereby validating Moore’s law.
Third of all, in time, established products improve to a point where they exceed performance demanded, in both low end and high end market. For example:
- today’s average Desktop PC can store up to 1To (1000 Gigabytes), which is more than the average user would ever need.
- And, as I was writing in a previous post, Microsoft has added so many improvements to its Office products, that I really don’t use most of them.
This is critical in understanding the innovator’s dilemma. Clayton Christensen shows that established companies working for mainstream customers always end up to overshooting, over exceeding what their customers want, and, as we shall see, this creates a vacuum a the lower end of the market for potential new entrants. This will be the subject of next week’s post.
Are you seeing similar trends in your industry? Are you able to identify a specific performance criteria which has been improving continuously over time? Are you seeing your company overexceeding what customers want?
Further readings:
- For an introduction to the patterns in disruptive innovation in very different industries, including the disk drive industry, healthcare, and steel, the disk drive industry, please refer to Clayton Christensen’s video at NJIT
- For a comprehensive discussion of disruptive innovation and why disruptive innovation puts leading companies out of business, please refer to Clayton Christensen’s Innovator’s Dilemma, chapter 11
- For a very good presentation of disruptive innovation: what it means and how it works, please refer here
- For a series of very interesting blog posts on disruptive innovation, please refer to this blog
- For a discussion on when to innovate and when to refrain from innovating, please refer to Michael Porter’s Competitive Advantage, chapter 15; Chapter 5 talks about how disruptive innovation can fundamentally alter industry profitability


[…] Maximize competitive advantage through innovation Skip to content HomeMailing list « Anticipating disruptive innovation (2 of many…) What's "strategic innovation" : a fuzzy word or a meaningful concept? » ← […]